
The dashboard is not the decision.
An organisation can hit every target and still head in the wrong direction. Every dashboard hides choices about what counts as success, and leaders need to keep asking whether those choices still hold.
A dashboard is not the decision because every dashboard reflects choices about what counts as success. Targets change behaviour and can pull an indicator away from the outcome it was meant to represent, and a company can perform well against a strategy that is losing relevance. Leaders must judge which outcomes are worth pursuing, even when a familiar KPI suffers.
On this page7 sections
In January 2018, Mark Zuckerberg announced a change at Facebook that sounded peculiar for a business built around advertising: he expected people to spend less time on the platform.
Facebook was adjusting its News Feed to favour posts that encouraged conversation between friends and family. Zuckerberg said the change would probably reduce time spent and some measures of engagement, but argued that the time people did spend there would become more valuable. The company explained the change publicly.
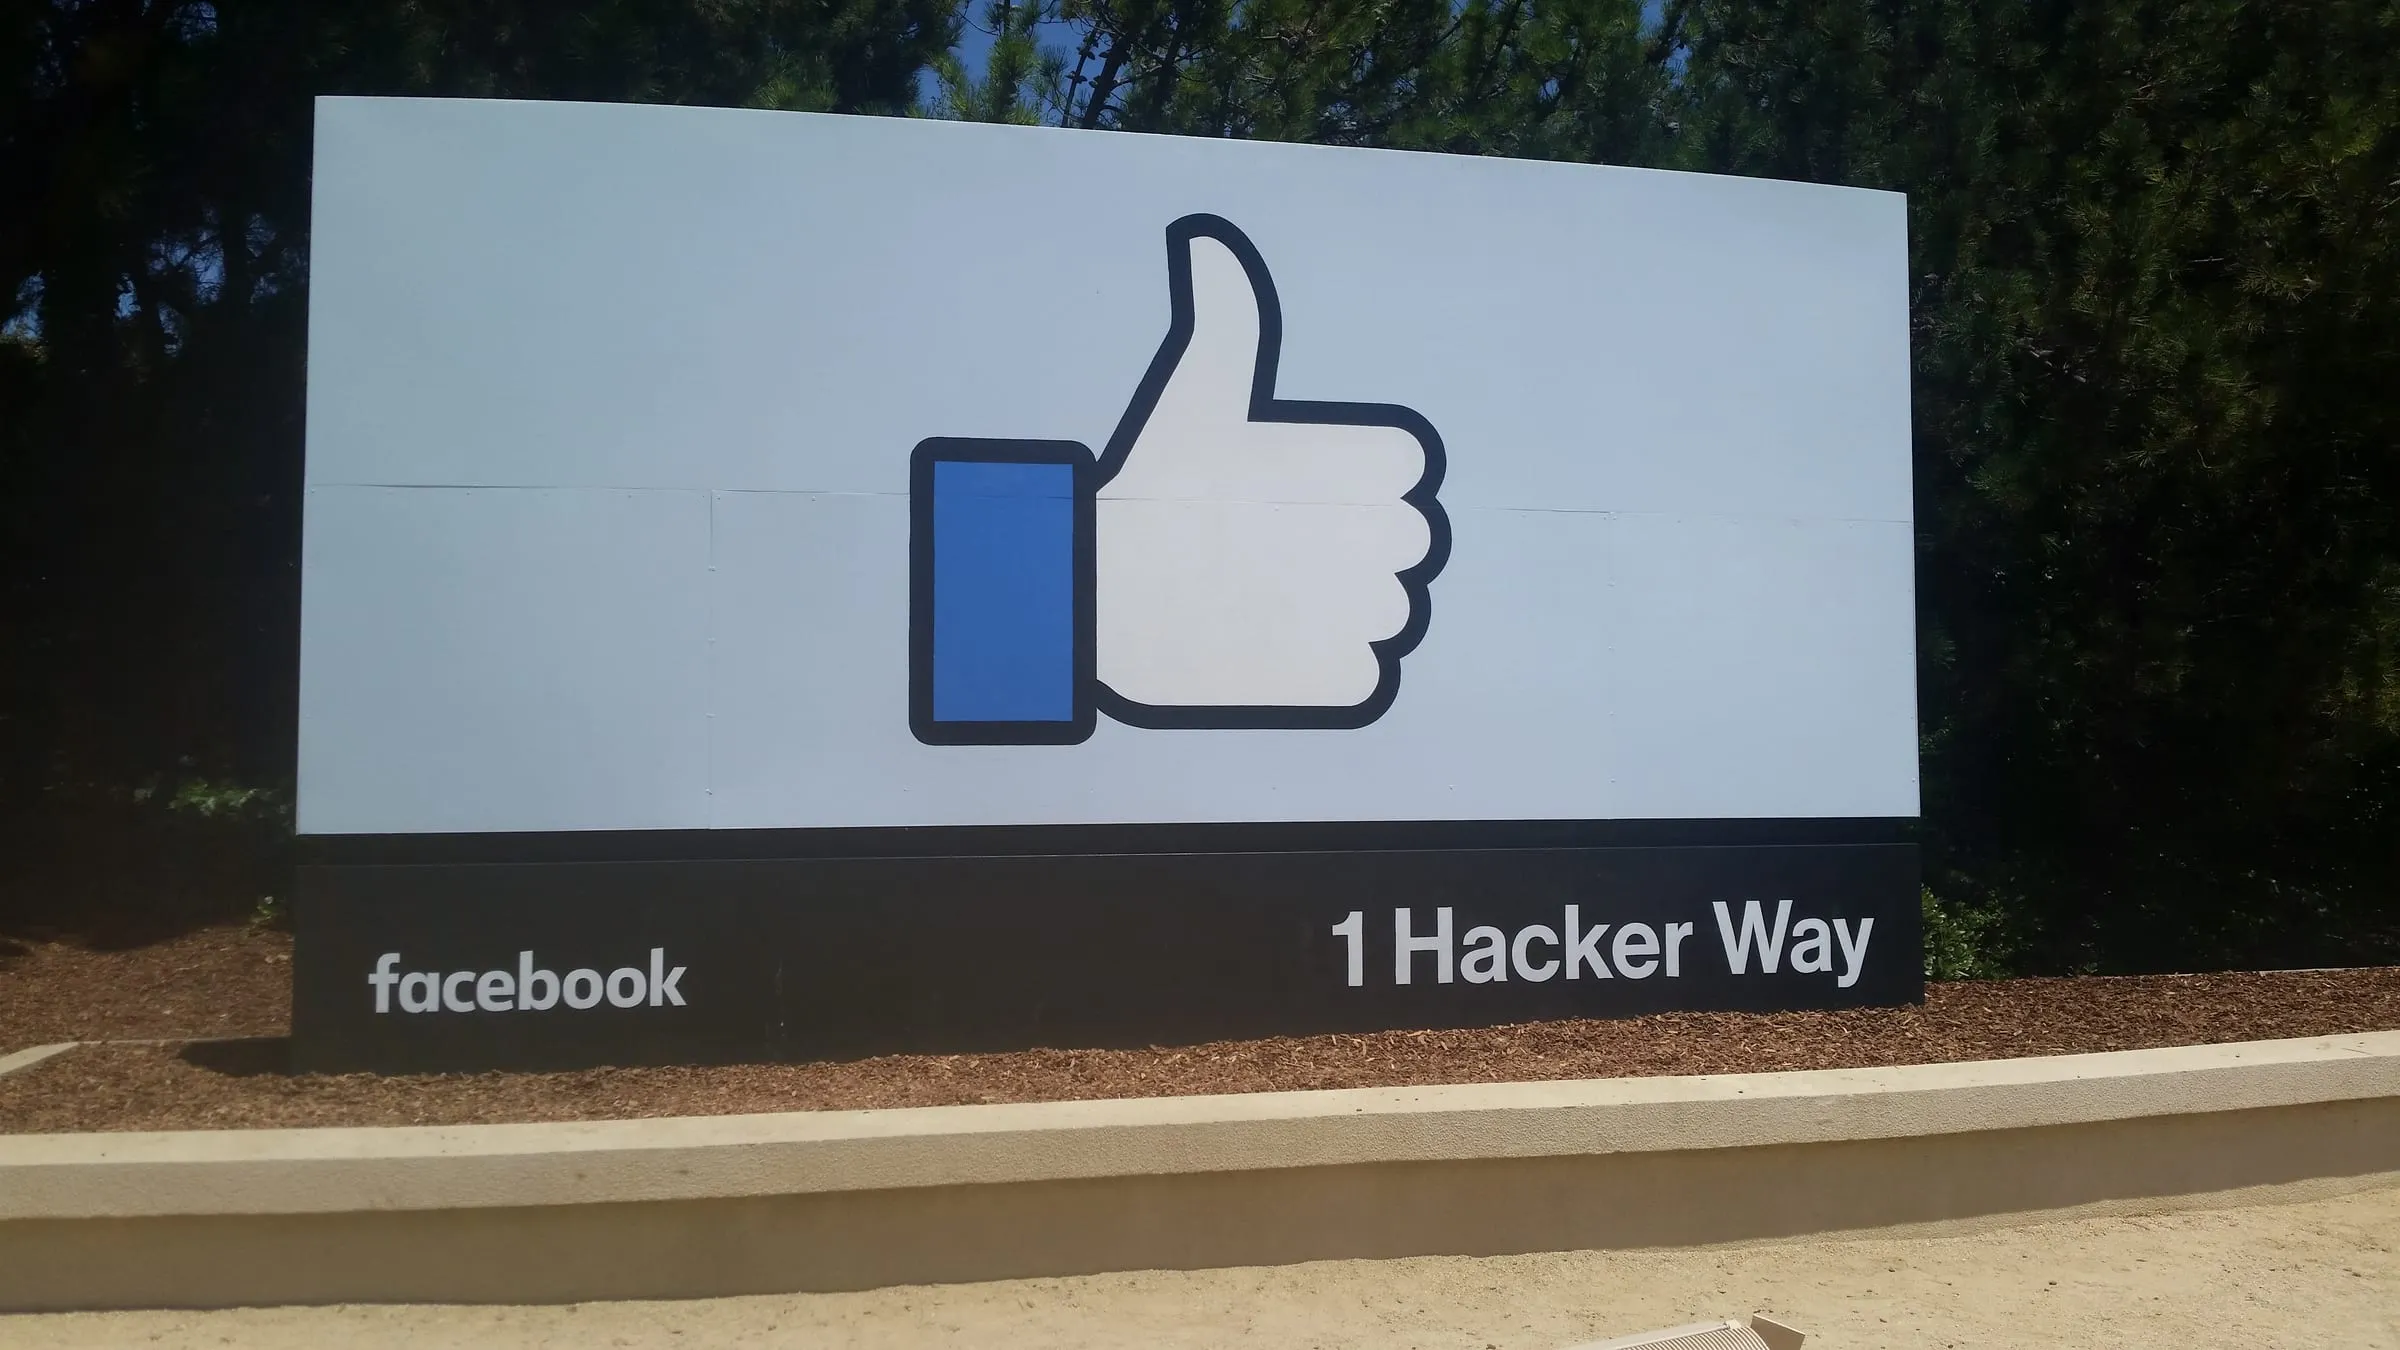 Facebook’s headquarters at 1 Hacker Way, Menlo Park, 2017. Minette Lontsie, CC BY-SA 4.0. Source

Whether Facebook ultimately delivered on that ambition is a separate, much larger question. The announcement itself reveals something interesting. A familiar measure of success was expected to move in the wrong direction, and the chief executive was making the case for why that might be desirable.
Imagine saying the equivalent at your next board meeting: One of our headline numbers is going to get worse. We believe that is the right decision.
You would need a better explanation than a dashboard could provide.
 A board room in Phoenix, Arizona, 2018. Frank Schulenburg, CC BY-SA 4.0. Source

Most organisations spend considerable effort learning how to measure progress. Far less attention goes to a more awkward possibility: what if the thing we have become excellent at measuring is no longer the thing we most need to achieve?
The judgement hidden inside the numbers
A dashboard looks like a report on reality. Revenue, margins, customer retention, delivery times and employee turnover are presented as facts, often with a reassuring green arrow or an alarming red one.
The figures may be entirely accurate. But before anyone opens the report, a series of choices has already been made. Somebody selected the indicators, decided how to calculate them, chose a time period and determined what qualifies as good performance.
These choices make the dashboard useful. An organisation is too complicated to hold in your head all at once. You need a manageable way to notice changes and ask better questions.
You also need to remember what has been left outside the frame.
Take customer retention. A high rate might suggest that people value what a company provides. It could also reflect long contracts, the difficulty of switching suppliers or a market in which customers have few alternatives. Retention matters in all these situations, but it does not mean quite the same thing in each.
Or consider productivity. More work completed per employee may indicate a genuinely better process. It may also mean that experienced people have stopped mentoring colleagues, maintenance has been postponed or work that requires care has been rushed. Some of those costs will not appear in the same reporting period.
The right response is to resist supplying an improving number with an explanation it has not earned, without distrusting it outright.
A dashboard can tell a leader that something has changed. Even a sophisticated one that models or forecasts outcomes cannot determine, unaided, what that change ought to mean for the organisation.
When the measure becomes the ambition
There is another complication. People do not merely appear in performance reports. They respond to them.
If a business rewards speed, employees will pay attention to speed. If sales volume determines bonuses, people will work to increase sales volume. If a department is judged mainly on its costs, the pressure to reduce those costs will shape its decisions.
Often, that is precisely the point of setting targets. The problem begins when the target becomes more important than the purpose for which it was chosen.
At Wells Fargo, the number of products sold per customer became a closely watched measure of the bank’s cross-selling strategy. In 2016, US regulators described how sales targets and compensation incentives had contributed to employees opening accounts without customers’ authorisation. In a later enforcement action, the US Securities and Exchange Commission found that the publicly reported cross-sell metric was inflated by accounts and services that were unused, unneeded or unauthorised, and that investors had been misled.
This was serious misconduct, not an ordinary reporting mistake. The bank’s actions involved incentives, management decisions and failures of oversight. But the regulatory findings make the underlying leadership problem difficult to miss: a measure intended to reflect valuable customer relationships had become detached from the customers themselves.
 A Wells Fargo branch at Union Square, Manhattan, 2018. Tdorante10, CC BY-SA 4.0. Source

Economist Charles Goodhart described a related problem in the context of monetary policy. Statistical relationships useful for observing a system can become less reliable when authorities use them to control it. The generalised principle is now familiar far beyond economics: pressure to improve a measure can change the behaviour that the measure was supposed to describe.
You do not need a scandal for this to happen. The effects can be quieter. A team starts choosing projects that are easier to count. A manager avoids a worthwhile experiment because it would hurt this quarter’s figures. A business becomes exceptionally good at serving the customers it already understands while overlooking the people whose needs are changing.
The dashboard has not instructed anyone to make those choices. The organisation has created an environment in which those choices make sense.
A green dashboard can describe the wrong future
Imagine a profitable business with dependable customers and a mature product. Sales are healthy. Delivery is efficient. The existing customer base is loyal.
These are achievements worth recognising.
Now suppose the problems customers need solved are beginning to change. The company still performs its established work very well, so most indicators remain favourable. The people who sense the shift may be a small group of engineers, customers asking unusual questions or employees who keep losing opportunities that do not yet fit an existing sales category.
A dashboard built to monitor the current business might register little cause for alarm. Its indicators were selected to tell management how well the established model was functioning. They were not necessarily designed to ask whether that model would remain relevant.
This is a hypothetical situation, but the dilemma is real. A company can become more efficient at doing something that matters less with every passing year.
At that point, the executive team faces three different questions. Are the numbers accurate? What explains them? And, most importantly, are we still pursuing the right outcome?
The first is a matter of measurement. The second needs investigation and interpretation. The third is a matter of strategy and judgement.
It can require deciding to accept lower margins while developing a new capability, to leave a profitable market that no longer fits the company’s direction, or to invest in a relationship whose value will not appear in the next quarterly report. None of these is automatically a wise decision. Each requires evidence, an understanding of the alternatives and a willingness to be held accountable for the consequences.
More data may improve the quality of that choice. It cannot make the choice disappear.
What kind of organisation are we rewarding?
The influence of a metric does not stop with the executive who selected it. It reaches the people whose work is assessed through it.
An ambitious promise such as we want to be the most trusted supplier in our field is difficult to fit into a spreadsheet. So the company chooses indicators: repeat purchases, complaints, contract renewals, perhaps a customer survey.
All can be useful. Then reporting routines develop around them. Targets are assigned. Bonuses and budgets begin to depend on performance. Over time, the easier question (did we hit the target?) can crowd out the harder one: have we actually become more trustworthy?
A company can reduce reported complaints by making support harder to reach. It can improve short-term profitability by postponing work that protects reliability. It can increase revenue through discounts that attract customers it cannot serve sustainably.
These are possibilities, not conclusions to draw whenever a number looks good. In each case, the task of leadership is to investigate whether improving the indicator still represents improvement in the underlying business.
This is why measurement needs more than additional measures. It needs people who are willing to tell an inconvenient story about what the measures mean. Someone from customer support may understand a rise in renewals differently from the finance team. An engineer may question a successful launch metric because they know which compromises made the deadline possible. A new employee may notice an accepted practice that senior leaders no longer see.
None of these perspectives deserves automatic authority. They deserve to be heard, checked and compared with what the numbers show.
The more smoothly a dashboard tells its story, the more valuable a credible challenge to that story can become.
The decision before the dashboard
Facebook’s leadership had not discovered a perfect new measure of a worthwhile social interaction. The idea of a meaningful interaction still required definitions, assumptions and choices about what to promote. Such choices were open to criticism, and the long-term consequences cannot be inferred from the announcement.
The interesting part was the order of reasoning. The company publicly stated a different ambition, accepted that familiar indicators might fall, and proposed changing its product accordingly.
That order matters for any organisation, including one with no interest in social media or digital analytics.
There are moments when the right decision should make a dashboard look worse. Hiring more experienced people may raise costs before it improves capability. Refusing unsuitable customers may slow revenue growth. Allowing teams time to fix underlying problems may reduce output in the short term. A founder might deliberately sacrifice speed because the company has reached a point where mistakes are becoming too expensive.
Those choices are not automatically brave or farsighted. Sometimes they are merely costly. A leader still owes the organisation a credible account of why the sacrifice is justified and what evidence would show that the bet is failing.
That is what separates responsible judgement from using long-term thinking as an excuse for disappointing results.
The same discipline should apply when the numbers improve. A green arrow deserves an explanation, not applause by reflex.
At the next leadership meeting, try beginning somewhere other than the first KPI. Ask what the organisation is currently trying to become. Then look at the numbers and consider whether success against those indicators would actually move it in that direction.
There is a revealing question to put to the room: If all of these measures improved again next year, what could still be going wrong?
Perhaps the answer is nothing serious. That is worth knowing. But if the room can name a credible danger, such as deteriorating trust, an ageing product, growing dependence on a handful of customers or a culture that discourages dissent, then the dashboard is incomplete in a way that matters. The next task is to find evidence, decide what to do and, where necessary, change what gets measured.
Dashboards are valuable precisely because they make parts of an organisation visible. They can expose unwelcome facts, test confident stories and reveal when an intervention is failing. Giving them less authority than a decision does not make the evidence less important.
It makes leadership more accountable for what the evidence is being used to pursue.
Questions
Why can't a dashboard make a business decision?
A dashboard cannot make a business decision because it can only organise observations, expose trends and sometimes support forecasts. A decision also requires choosing objectives, judging competing explanations, weighing risks and accepting trade-offs. A high customer-retention rate, for example, may reflect genuine loyalty or simply the difficulty of switching suppliers, and the numbers alone cannot say which.
Can hitting KPIs be bad for a company?
Hitting KPIs can be bad for a company if the KPIs encourage behaviour that improves the reported result while undermining the outcome the organisation actually cares about. Complaints can fall because support has become harder to reach, and profit can rise because work that protects reliability has been postponed. This is a possibility to investigate, not a reason to assume every favourable metric is misleading.
What is Goodhart's law in management?
Goodhart's law began in economics: Charles Goodhart observed that statistical regularities useful for observing a system can become unreliable when authorities use them to control it. In management, the idea is often applied to performance targets. Once a metric is used to reward or penalise people, their behaviour can change what it measures, as the Wells Fargo cross-selling case illustrates.
What should executives ask when reviewing a dashboard?
When reviewing a dashboard, executives should ask whether the numbers are accurate, what explains them and whether they still describe progress towards the organisation's intended future. A useful challenge for the room is: if these indicators improved for another year, what important problem might still be getting worse? Deteriorating trust, an ageing product or dependence on a few customers would all count.
Sources
- Bringing People Closer Together
- Facebook to overhaul News Feed to focus on friends and family
- CFPB Fines Wells Fargo $100 Million for Widespread Illegal Practice of Secretly Opening Unauthorized Accounts
- Wells Fargo to Pay $500 Million for Misleading Investors About the Success of Its Largest Business Unit
- Goodhart's Law
- Michael Harris and Bill Tayler: Don't Let Metrics Undermine Your Business